Sales Coaching Metrics: What to Measure Beyond Win Rate
Part of the Sales Coaching guide: The Complete Sales Coaching Guide: Build a Program That DeliversWin rate only tells part of the story. Learn the 7 sales coaching metrics that predict performance, reveal skill gaps, and prove ROI—before deals close.
Key takeaways
- Win rate is a lagging indicator that shows results 60-90 days after coaching; leading sales coaching metrics like behavior adoption rate and skill progression velocity predict performance before deals close.
- Coaching frequency per rep should average 2-3 sessions per month, but the metric that matters more is behavior adoption rate—whether reps actually apply what you teach within 7 days of a session.
- Skill progression velocity measures improvement per coaching hour invested; high-performing coaching programs see 15-20% skill score increases per month, while ineffective programs plateau below 5%.
- Conversation quality score (measured by talk-to-listen ratio, question quality, and objection response time) predicts win rate 45-60 days in advance and reveals exactly where reps need support.
- Time-to-first-win for new reps should decrease quarter-over-quarter as your coaching program improves; if it's static or rising, your onboarding coaching isn't working.
Most sales leaders measure coaching by looking backward. They track win rate, quota attainment, and revenue—outcomes that reflect what already happened 60 to 90 days ago. By the time those numbers move, the deals are closed (or lost), the quarter is over, and your chance to intervene is gone.
Sales coaching metrics should do the opposite: they should predict performance, surface skill gaps before they cost you deals, and prove ROI in real time. The problem is that most teams don't know what to measure beyond activity and results. You end up with a dashboard full of dials, meetings booked, and closed-won percentages—none of which tell you whether your coaching is actually working.
This guide breaks down the seven sales coaching metrics that matter, how to track them without adding admin burden, and how to use them to build a coaching program that delivers measurable results. If you're building a coaching engine (or trying to prove its value to leadership), these are the numbers that will get you there.
For a broader view of how these metrics fit into a complete coaching system, see our comprehensive sales coaching guide.
Leading vs. lagging: why most teams measure the wrong things
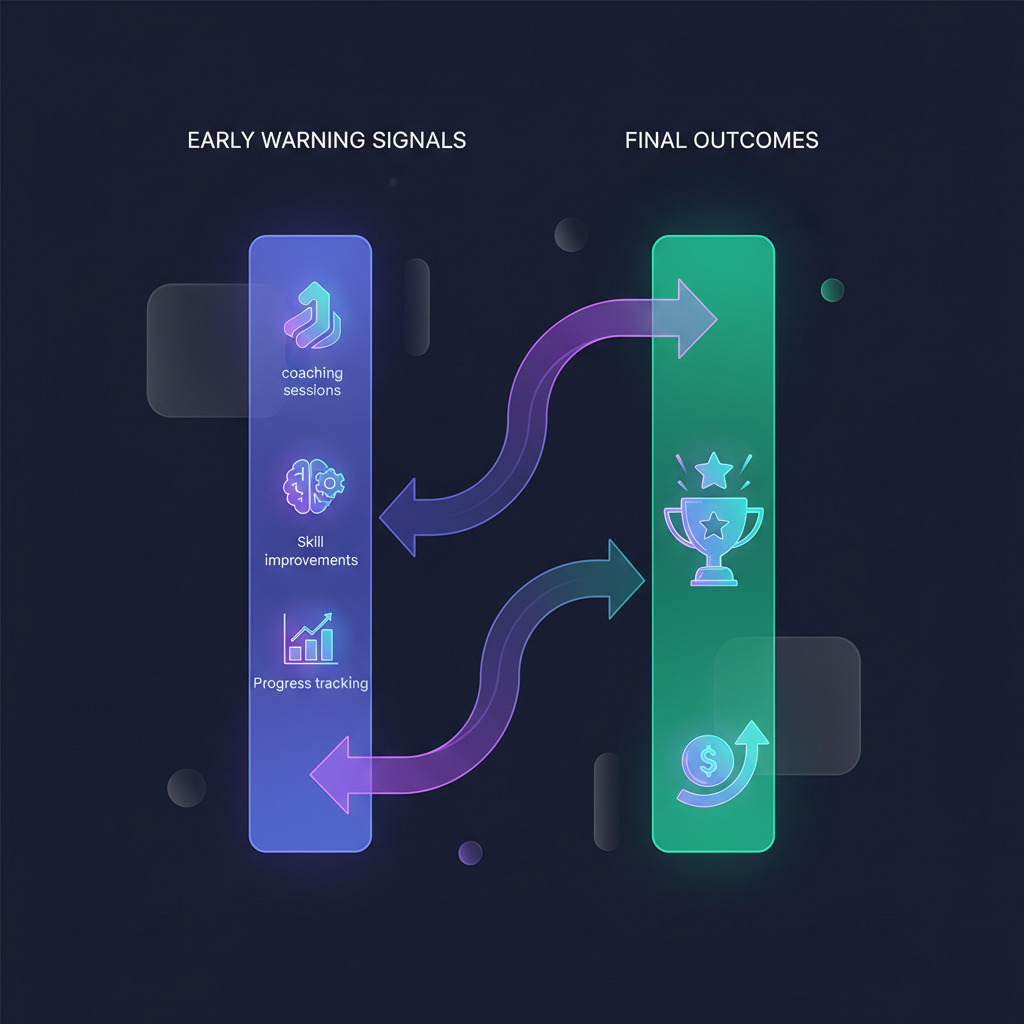
Lagging indicators—win rate, revenue, quota attainment—are essential for scorekeeping, but they're terrible for coaching. They tell you what happened, not why it happened or how to fix it. A rep who misses quota in Q2 probably struggled with skills you could have addressed in Q1, but lagging metrics don't surface that until it's too late.
Leading indicators predict future performance. They measure behaviors, skills, and adoption patterns before those inputs turn into outcomes. If a rep's objection handling success rate drops in Week 3, you can intervene in Week 4—long before it shows up in their pipeline conversion rate 60 days later.
According to Gartner research on sales coaching, high-performing sales organizations are 2.3 times more likely to use leading indicators to guide coaching decisions. They track skill progression, behavior change, and conversation quality—metrics that let them adjust in real time rather than react to results.
The shift from lagging to leading metrics requires three changes:
- Instrumentation: You need tools that capture rep behavior at the conversation level—call recordings, AI scoring, role-play results—not just CRM activity logs.
- Frequency: Leading indicators require weekly or bi-weekly measurement, not quarterly reviews.
- Action triggers: Each metric needs a threshold that triggers a coaching intervention (e.g., if objection response time exceeds 4 seconds, schedule a session).
When you measure coaching with leading indicators, you turn it from a reactive art into a predictive system. You stop asking "Why did this rep miss quota?" and start asking "What skill gap will cost us deals next month if we don't address it now?"
The 7 sales coaching metrics that predict performance

1. Coaching frequency per rep
This is the baseline: how many one-on-one coaching sessions does each rep receive per month? Not team meetings, not ride-alongs—dedicated, structured coaching time.
The optimal coaching frequency for most teams is 2-3 sessions per rep per month, each 30-45 minutes. Below that threshold, reps don't retain skills or build momentum. Above it, you hit diminishing returns (and managers burn out).
Track this metric by rep, by manager, and by cohort. If a manager consistently delivers fewer than 2 sessions per rep per month, that's a red flag—either they're overloaded or they're not prioritizing coaching. If a rep receives 4+ sessions but performance isn't improving, the issue isn't frequency; it's quality or relevance.
In QUOTA's role-play data, reps who receive at least 2 coaching sessions per month hit quota 34% more often than those who receive fewer than 1. But frequency alone doesn't guarantee results—you need to pair it with the next metric.
2. Behavior adoption rate
Behavior adoption rate answers the most important question about coaching effectiveness: Do reps actually do what you teach them?
Measure this by identifying a specific behavior taught in a coaching session—e.g., "Use a pattern interrupt in the first 10 seconds of a cold call"—and then tracking how often the rep applies it in real conversations within the next 7 days.
Calculate it as: Behavior adoption rate = (# of calls where behavior was applied) / (# of eligible calls) × 100
High-performing coaching programs see 60-75% adoption rates within 7 days. If adoption is below 40%, the coaching either wasn't clear, wasn't relevant, or wasn't reinforced.
This metric requires call recording and either manual review or AI scoring (most AI sales coaching tools can flag specific behaviors automatically). It's labor-intensive to track manually, but it's the single best predictor of whether coaching will move the needle.
For example, if you coach a rep on how to handle the "send me an email" objection and they face that objection 8 times in the next week, behavior adoption rate tells you how many of those 8 times they applied your framework. If the answer is 1 out of 8, you haven't solved the problem—you've just spent 45 minutes talking.
3. Skill progression velocity
Skill progression velocity measures how fast a rep improves a specific skill per hour of coaching invested. It's the ROI metric for coaching time.
To calculate it, you need a consistent way to score skills—either via AI role-play scores, manager evaluations, or conversation quality metrics. Then track the change in score over time, normalized by coaching hours.
Skill progression velocity = (Skill score at end of period – Skill score at start) / Total coaching hours in period
For example, if a rep's objection handling score improves from 62 to 74 (12 points) over 4 coaching sessions (3 hours total), their velocity is 4 points per hour. If another rep improves 3 points over the same time, their velocity is 1 point per hour—either the coaching isn't landing, or they're not practicing between sessions.
High-velocity reps (15-20% monthly skill improvement) tend to ramp faster, hit quota sooner, and require less ongoing intervention. Low-velocity reps (<5% monthly improvement) need either a different coaching approach, more practice repetitions, or a candid conversation about fit.
Skill progression velocity also lets you compare coaching effectiveness across managers. If Manager A's reps improve at 12 points per hour and Manager B's improve at 4, you've identified a coaching skill gap at the manager level—and you can coach the coach.
4. Conversation quality score
Conversation quality score is a composite metric that evaluates the mechanics of a rep's calls or meetings. It typically includes:
- Talk-to-listen ratio: Healthy discovery calls are 40:60 (rep:prospect); demo calls are closer to 50:50. Reps who talk more than 60% of the time lose deals.
- Question quality: Are they asking open-ended, pain-focused questions, or yes/no surface questions?
- Objection response time: How long does it take the rep to respond after a prospect raises an objection? Pauses over 4 seconds signal hesitation; under 1 second signals they're not listening.
- Filler word frequency: "Um," "like," "you know"—more than 3 per minute erodes credibility.
- Next-step clarity: Does the call end with a clear, mutual commitment, or a vague "I'll follow up"?
Most conversation intelligence platforms (Gong, Chorus, Clari) calculate a version of this score automatically. If you're not using one, you can manually score 2-3 calls per rep per month using a simple rubric.
Conversation quality score predicts win rate 45-60 days in advance. A rep whose score drops from 78 to 64 over two weeks is headed for a pipeline problem—even if their activity metrics look fine. That's your cue to intervene with targeted coaching (e.g., objection handling training if response time is the issue, or discovery question work if talk ratio is off).
5. Objection handling success rate
Objection handling success rate measures how often a rep successfully navigates a common objection and keeps the conversation moving forward (vs. ending the call or punting to email).
Identify your team's top 5-7 recurring objections—"not interested," "send me information," "we're happy with our current solution," "no budget," etc.—and track outcomes when each one appears.
Objection handling success rate = (# of objections successfully navigated) / (# of objections raised) × 100
"Successfully navigated" means the prospect stayed on the call and agreed to a next step (not necessarily a closed deal—just forward motion). If a rep hears "not interested" 20 times in a week and converts 3 of those into booked meetings, their success rate for that objection is 15%. If another rep converts 9 out of 20, their rate is 45%—and you've identified a coaching gap.
This metric is especially valuable for new reps. In QUOTA's AI role-play sessions, reps who practice objection handling 10+ times before their first live call have success rates 28% higher than those who go in cold. You can use this metric to prove that practice works—and to identify which objections need more coaching attention.
For a deeper dive into frameworks that improve this metric, see our guide to objection handling training.
6. Time-to-first-win
Time-to-first-win measures how many days (or weeks) it takes a new rep to close their first deal after starting. It's a lagging indicator for the individual rep, but a leading indicator for your coaching program's effectiveness.
If your average time-to-first-win is 90 days and it's been stuck there for three quarters, your onboarding coaching isn't improving. If it drops to 75 days, you've validated that changes to your ramp program (more role-play, better shadowing, tighter feedback loops) are working.
Track this metric by cohort—not just overall average—so you can compare the impact of different onboarding approaches. For example, if Q1 hires (who went through your old onboarding) took 95 days to first win, and Q2 hires (who used AI role-play daily) took 68 days, you've quantified a 28% improvement in ramp time.
Time-to-first-win also correlates with long-term performance. Reps who close their first deal in under 60 days hit quota 42% more often in their first year than reps who take 90+ days. Faster time-to-first-win doesn't just save you three weeks—it predicts whether the rep will succeed at all.
For teams looking to accelerate this metric, coaching SDRs without disrupting activity is critical—you can't afford to pull new reps off the phones for hours of live coaching, but you also can't let them struggle in silence.
7. Coaching engagement rate
Coaching engagement rate measures how actively reps participate in coaching—whether they complete assigned practice, show up prepared to sessions, and apply feedback.
This is a qualitative metric that requires manager observation, but you can quantify it with proxies:
- Practice completion rate: If you assign 3 role-play scenarios per week, how many does each rep complete?
- Session preparation: Does the rep bring a call recording or specific question to the coaching session, or do they show up cold?
- Follow-up action completion: If you agree on 2 action items at the end of a session, does the rep complete them before the next one?
Low engagement (<50% practice completion, frequent no-shows, no follow-through) is a leading indicator of churn. Reps who don't engage with coaching rarely improve, and they rarely last. High engagement (80%+ completion, proactive preparation) predicts quota attainment even when current performance is below target.
Engagement rate also reveals whether your coaching is relevant. If a high-performer suddenly stops engaging, it's often because the coaching feels generic or disconnected from their real challenges. That's your signal to customize.
How to track sales coaching metrics without drowning in admin
The biggest objection to tracking coaching metrics is time: "I don't have bandwidth to score every call and build dashboards." Fair. Here's how to instrument these metrics without adding hours of manual work.
Use AI to automate conversation scoring. Tools like QUOTA, Gong, and Chorus automatically score talk-to-listen ratio, objection handling, question quality, and filler words. You don't need to listen to every call—just review the AI-flagged outliers (the 7/10 calls and the 3/10 calls) and coach from there.
Batch-review practice sessions. Instead of live role-play that requires your time, assign reps AI-driven role-play scenarios they complete async. Review their recordings in 10-minute blocks and leave timestamped feedback. This scales measuring AI sales training ROI without burning manager hours.
Build a simple coaching tracker. A shared spreadsheet or Notion doc with columns for rep name, session date, skill focus, behavior taught, and 7-day adoption check is enough. Update it once a week during your pipeline review. Don't over-engineer this.
Tie metrics to CRM data. Time-to-first-win, objection handling success rate, and conversation quality score can all pull from existing data in your CRM or conversation intelligence platform. If you're already logging calls and tracking deal stages, you're 80% of the way there.
Review metrics in layers. Weekly: individual rep behavior adoption and conversation quality. Monthly: cohort-level skill progression and engagement. Quarterly: program-level ROI (time-to-first-win, coaching hours vs. quota attainment). You don't need to look at everything every day.
The goal isn't a perfect dashboard—it's a feedback loop that lets you adjust coaching before performance craters.
How to use coaching metrics to prove ROI to leadership
Leadership wants to know: "Is coaching worth the time investment, or should managers just focus on pipeline?"
Here's how to answer that question with data, using the metrics above.
Build a before/after comparison. Pick a cohort of reps, measure their baseline performance (win rate, quota attainment, time-to-first-win), implement structured coaching with tracked metrics, and measure the same outcomes 90 days later. If time-to-first-win drops from 85 days to 62 days, that's 23 days of faster productivity per rep—quantifiable revenue impact.
Correlate coaching frequency with quota attainment. Pull your coaching tracker and your quota attainment data. Segment reps into three buckets: <1 session/month, 1-2 sessions/month, 2+ sessions/month. Compare quota attainment across buckets. In most orgs, the 2+ bucket outperforms by 20-40%. That's your ROI story.
Show skill progression velocity vs. ramp time. Reps with high skill progression velocity (15%+ monthly improvement) ramp 30-50% faster than low-velocity reps. If faster ramp saves you $50K in unproductive salary per rep, and you onboard 20 reps per year, that's $1M in value—easy to justify a coaching investment.
Highlight behavior adoption impact. Track a specific behavior (e.g., using a discovery framework) and compare win rates for reps who adopt it (60%+ of the time) vs. those who don't. If the adopters win 12% more often, you've tied coaching directly to revenue.
For a deeper dive into proving value, see our guide on measuring AI sales training ROI.
The key is to connect leading indicators (the metrics you control) to lagging indicators (the outcomes leadership cares about). Show that coaching frequency and behavior adoption predict quota attainment 60 days later, and you've made coaching a revenue lever—not a nice-to-have.
Common mistakes when measuring sales coaching effectiveness
Measuring activity instead of outcomes. Tracking "number of coaching sessions delivered" is not the same as tracking whether coaching works. Frequency matters, but behavior adoption and skill progression velocity matter more.
Waiting for lagging indicators to move. If you only review coaching effectiveness at the end of the quarter, you've lost 12 weeks of intervention opportunity. Leading metrics let you course-correct in Week 3, not Week 13.
Ignoring engagement rate. A rep who completes 10% of assigned practice and skips half their coaching sessions will not improve, no matter how good your coaching is. Low engagement is a leading indicator of churn—address it early.
Coaching without baselines. If you don't measure a rep's objection handling success rate before you coach them, you can't prove the coaching worked. Baseline every skill before you invest time improving it.
Treating all reps the same. High performers and struggling reps need different metrics. High performers benefit from advanced skill refinement (conversation quality score, question sequencing); struggling reps need foundational behavior adoption (objection handling success rate, talk-to-listen ratio). Measure what matters for each segment.
Not sharing metrics with reps. Coaching metrics aren't just for managers—they're motivational tools for reps. When a rep sees their skill progression velocity climb from 3 to 12 points per hour, they understand that practice works. Transparency drives engagement.
FAQ
What are the most important sales coaching metrics to track?
The most important sales coaching metrics include coaching frequency per rep, skill progression velocity, behavior adoption rate, conversation quality score, objection handling success rate, time-to-first-win, and coaching engagement rate. These leading indicators predict performance before lagging metrics like win rate show results.
How do you measure the ROI of sales coaching?
Measure sales coaching ROI by tracking skill progression velocity (improvement per coaching hour), comparing ramp time for coached vs. non-coached reps, monitoring behavior adoption rates after sessions, and correlating coaching frequency with quota attainment. Leading indicators like conversation quality scores predict revenue impact 30-60 days before close.
How often should you measure sales coaching effectiveness?
Review coaching metrics weekly for individual rep progression, monthly for cohort trends and skill gaps, and quarterly for program-level ROI. Leading indicators like behavior adoption should be tracked after every coaching session, while lagging metrics like win rate require 60-90 day windows to show correlation.
What's the difference between leading and lagging sales coaching metrics?
Leading sales coaching metrics predict future performance and include skill progression velocity, behavior adoption rate, and conversation quality scores. Lagging metrics like win rate, quota attainment, and revenue measure outcomes that already happened. Leading indicators let you adjust coaching before deals are lost.
How do you track behavior adoption rate after coaching sessions?
Track behavior adoption rate by identifying a specific behavior taught in a coaching session, then measuring how often the rep applies it in real calls within 7 days. Use call recordings and AI scoring tools to flag the behavior automatically. Calculate as (# calls with behavior applied / # eligible calls) × 100. High-performing programs see 60-75% adoption within a week.
What is a good skill progression velocity for sales reps?
A good skill progression velocity is 15-20% monthly skill score improvement, or 3-5 points per coaching hour invested. Reps improving below 5% per month are either not practicing between sessions, receiving irrelevant coaching, or struggling with foundational skills that need a different approach.
How does conversation quality score predict win rate?
Conversation quality score measures talk-to-listen ratio, question quality, objection response time, and filler word frequency—mechanics that directly influence buyer trust and engagement. Reps with scores above 75 (on a 100-point scale) win deals 30-40% more often than those below 60. The score predicts win rate 45-60 days in advance, giving you time to coach before pipeline suffers.

Stefano Breglia
Co-founder, QUOTA Training
Stefano Breglia is co-founder of QUOTA Training. He focuses on sales methodology, deal progression and how AI simulation accelerates rep ramp time across the SDR, BDR, AE and AM roles.
Turn this into reps, not just reading
QUOTA Training lets your team practise these exact scenarios with an AI buyer that reacts like the real thing — then scores every call.
See it in action